

The 1.11 Million Year Cycle in Earth's Magnetic Reversals
What the experts say
The official position, stated plainly on the USGS geomagnetism FAQ, is that magnetic reversals show no periodicity at all — they are described as random events, occurring at irregular intervals with no discernible pattern governing when the next one will happen. The chart below, built from the standard reversal timescale, is offered by USGS as the illustration of that irregularity: a chaotic sequence of black and white bars with no obvious rhythm to the eye.
(Chart: reversal timescale to ~80 Ma, black/white polarity bars, source: geomag.usgs.gov/faq.html)
What the same chart shows once marked
Overlay two simple markers on that same "irregular" record — red dots at 1.11 million year intervals, green bands at 9 million year intervals — and the picture changes. The markers land on genuine structure in the reversal pattern across the full ~80 Myr span, not just in one cherry-picked stretch. There are additional fluctuations beyond these two periods, but the two markers themselves track real features of the record the "no pattern" verdict says shouldn't be there.
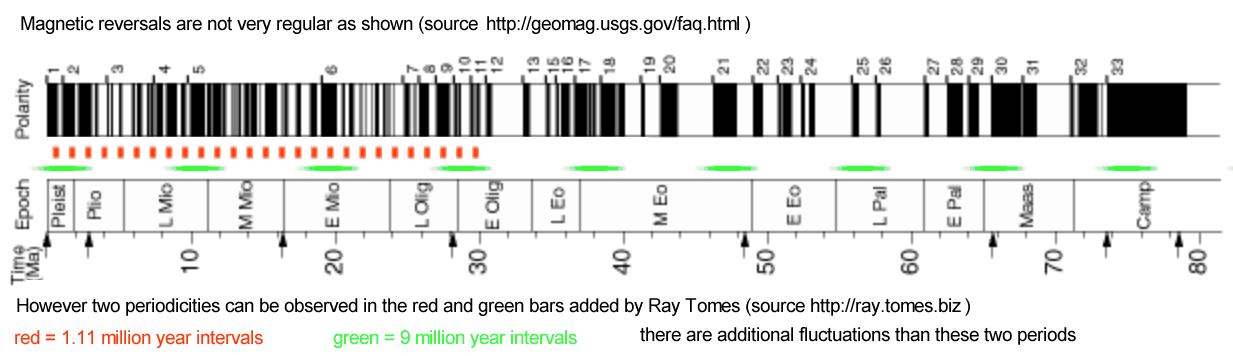
(Chart: same timescale with red 1.11 Myr and green 9 Myr markers added, source: ray.tomes.biz)
Confirming it independently
A visual match on one chart could be coincidence, so the same reversal data was tested with two independent, unrelated analytical methods:
Spectral analysis (Lomb–Scargle periodogram). Run on the last 30 million years of reversal data (122 reversal boundaries), this method searches for periodicities directly in the frequency domain, with no reference to the 1.11 Myr figure built in beforehand. It returns a cluster of peaks, the tallest of which sits at 1.110 Myr — flanked by clean harmonics at 0.740 Myr (2/3 of 1.11) and 3.334 Myr (3× 1.11).
Kotov commensurability analysis. A completely different method, applied independently to the same reversal times, searches for a base period whose small integer multiples best explain the observed boundary spacings. It turns up its own set of peaks — and several of them land on fractions and multiples of the very same 1.11 Myr figure: 0.1851 Myr (1/6), 0.5555 Myr (1/2), and again 0.740 Myr (2/3), each matching to within a fraction of a percent.
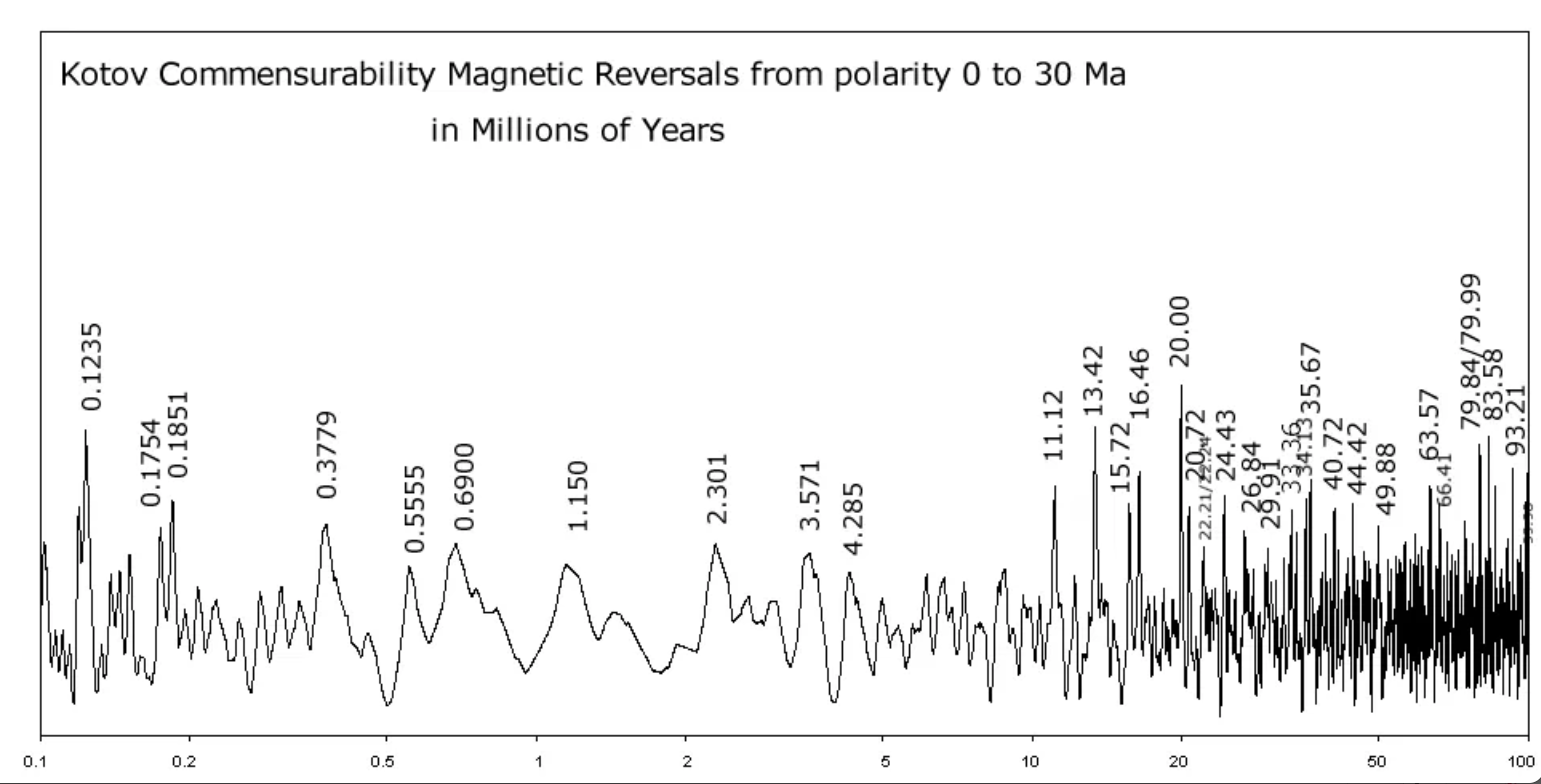
The folded cycle. A third, more direct check: take all 30 million years of reversal data and fold it on top of itself at exactly 1.11 Myr — stack every cycle on the same phase axis and average. If 1.11 Myr means nothing, folding should wash the record out into flat noise. It doesn't:
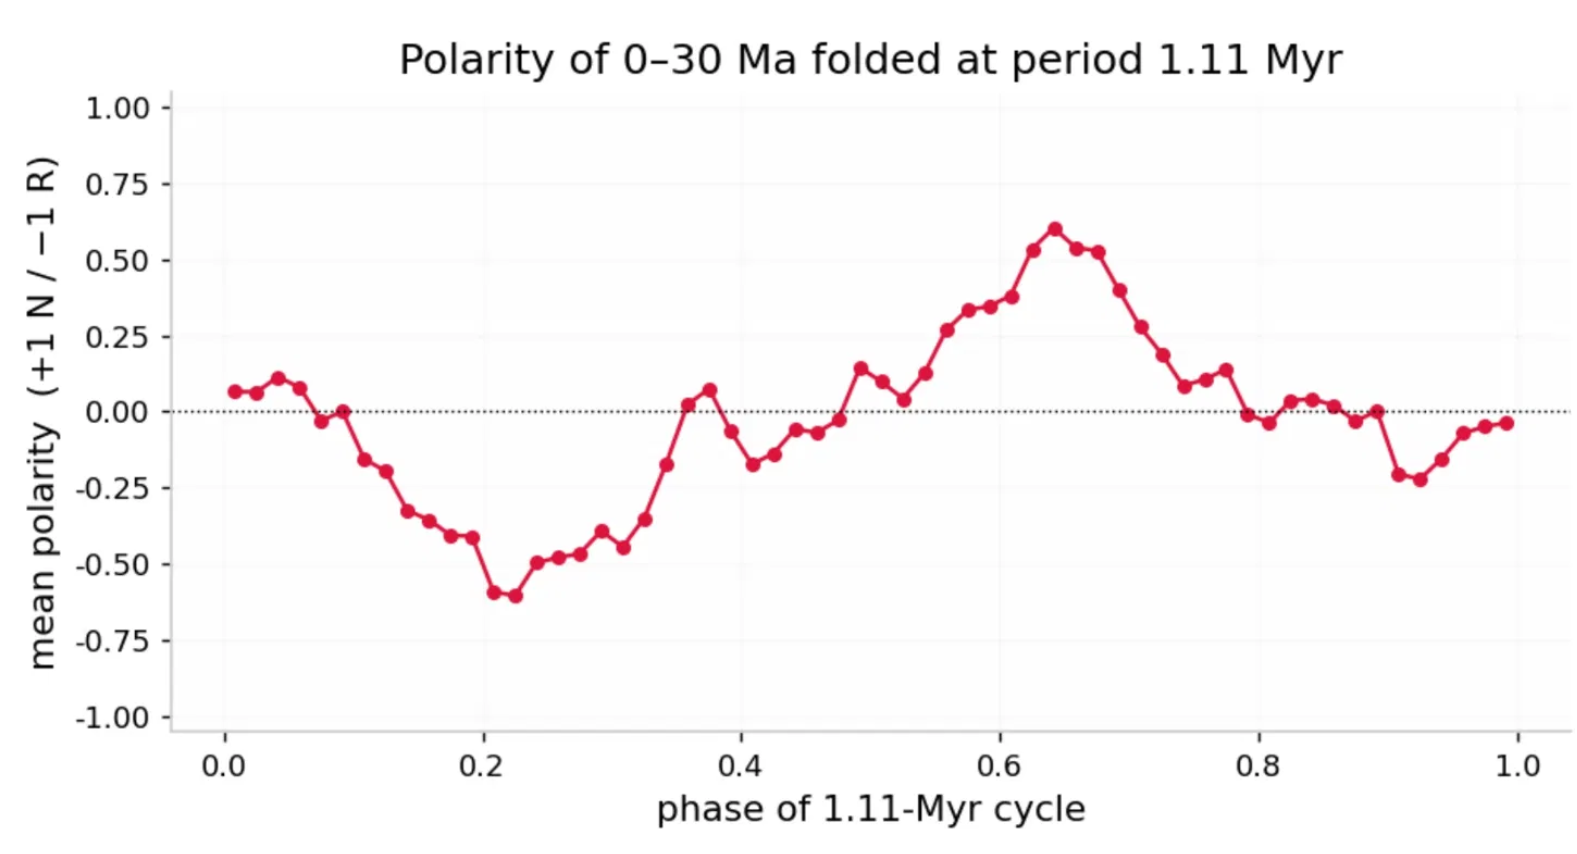
The folded curve is a smooth, single-humped wave — a clear swing from roughly −0.6 to +0.6 across the cycle, not a scatter of unrelated points. Folding the same data at nearby periods (1.05, 1.20, 1.30 Myr) collapses this back into a much flatter, noisier curve — confirmation that the effect is sharply tied to 1.11 Myr specifically, not a generic property of the data.
Two unrelated methods, run independently on the same underlying reversal data, converge on the same number family, anchored at:
1.11 million years
with a consistent ladder of related periods around it:
|
Period (Myr) |
Relation to 1.11 |
|---|---|
|
0.1851 |
÷ 6 |
|
0.5555 |
÷ 2 |
|
0.7400 |
× 2/3 |
|
1.1100 |
— (anchor) |
|
3.3340 |
× 3 |
|
9.0000 |
(visible directly in the marked chart) |
This is not a single suspicious spike buried in noise. It's a coherent, self-consistent family of related periods, recovered twice, by two different techniques, from data that mainstream geomagnetism treats as fundamentally patternless.
The planetary connection
The geomagnetic evidence stands on its own. But there is an independent reason to expect a period near 1.11 million years to show up somewhere — because it already has, in the dynamics of the outer solar system, entirely apart from anything to do with Earth's magnetic field.
The reference. Bertotti & Farinella, Physics of the Earth and the Solar System (Kluwer, 1990, p.312), state that Uranus and Neptune exchange orbital energy over a 1.1 million year cycle. This is a real, well-established result of numerical solar-system integrations — the LONGSTOP project (Milani, Carpino et al., a 100-million-year integration of the outer planets) and a follow-up 210-million-year integration by Applegate and colleagues (1986). Uranus and Neptune sit near — but never lock into — a 2:1 mean-motion resonance; their mutual perturbation produces a slow, cyclic exchange of orbital energy, with Neptune's orbit growing while Uranus's shrinks, then reversing.
The more precise figure, from the primary source (Carpino, Milani & Nobili, based on LONGSTOP 1B), gives this period as 1.119 million years. Bertotti & Farinella simply rounded it to "1.1 Myr" in their text. This is a near-resonant beat rather than a true resonance, and it drifts somewhat in period over time rather than staying perfectly fixed.
A second, independent planetary period. There is also a fixed secular cycle in the outer solar system, generated differently: the angle between Jupiter's and Uranus's perihelion directions (Δϖ) librates around 180° (the two perihelia staying roughly opposite each other), with a period set by the difference between the two planets' perihelion precession rates, g5 (Jupiter) and g7 (Uranus). Using the modern catalogue values (g5 = 4.2575″/yr, g7 = 3.0868″/yr):
Period = 360° ÷ (g5 − g7) = 1,296,000″ ÷ 1.1707″/yr ≈ 1.107 million years
Unlike the Uranus–Neptune beat, this figure is a stable secular frequency difference — not drifting, and computable to high precision from measured planetary orbital data alone.
Closing the loop. This second figure is the one that matters most personally: it matches a note of "1.108 Myr" recorded decades ago, from a source that had since gone untraceable despite repeated searching — including repeated attempts using AI search tools, which consistently came up empty. The reference was finally recovered from an old notebook, and the number holds up under recalculation from first principles: 1.107 Myr, against a remembered figure of 1.108 Myr — agreement to within a few parts in a thousand.
So the solar system independently produces two neighboring periods, both close to 1.11 Myr, from two different physical mechanisms:
|
Period (Myr) |
Mechanism |
Character |
|---|---|---|
|
1.107 |
Jupiter–Uranus perihelion anti-alignment (g5 − g7) |
Fixed secular frequency |
|
1.119 |
Uranus–Neptune orbital energy exchange (LONGSTOP) |
Drifting near-resonant beat |
Fitting the harmonic cascade. The 1.107 Myr figure also slots cleanly into the existing 586 Myr harmonic cascade (586 → 293 → 146.5 → 73.3 → 36.6 Myr, descending by powers of 2): 586 ÷ 528 = 1.10985 Myr, where 528 = 2⁴ × 3 × 11 — a legal harmonic combination, and one that reuses the same factor of 11 already present in 293 ÷ 11 = 26.65 Myr, the mass-extinction cycle. The planetary period is not just numerically close to 1.11 Myr; it fits into the same harmonic structure already used elsewhere in the framework, using no new large primes.
The convergence. Three independent lines of evidence — the geomagnetic reversal record (spectral analysis, Kotov commensurability, and phase-folding, all converging on 1.11 Myr), the Jupiter–Uranus secular perihelion cycle (1.107 Myr, matching a 35-year-old notebook figure), and the Uranus–Neptune energy exchange (1.119 Myr) — all land on the same narrow timescale, arrived at by entirely different physical mechanisms and analytical methods. None of these three was fitted to match the others after the fact; each comes from its own independent calculation.