Cycles Research Institute
is pleased to announce its new
Cycles Analysis & Timeseries Software

CATS: Cycles Analysis & Timeseries Software
Cycles Research Institute is pleased to announce its new Cycles Analysis & Timeseries Software called CATS. This is a comprehensive and free package, please read the conditions of use below.
CATS is a system for storing many timeseries with different time bases including yearly, monthly, weekly, daily and many more. It comes with hundreds of collected time series from around the world, including both scientific and market data such as climate, astronomical, geophysical, economic, commodities, prices, and much more.
CATS can analyse series and determine cycles periods and phases precisely, and has many functions for manipulating data such as arithmetic, logs and transformations. It also inlcudes mutivariate techniques like correlation, regression, factor analysis and other tools that are useful for model building for economics, climate and in general studying the causal pathways by which cycles are transmitted.
Version 1.0 of CATS was released on 2-July-2010 and is now available for general usage. Web seminars will be held from early July for teaching people how to use CATS. Information on web seminars was posted to the interdisciplinary cycles group at Yahoo: http://tech.groups.yahoo.com/group/cyclesi/ so people interested in using CATS would be advised to join that group.
Any bugs were also reported to the interdisciplinary cycles group at Yahoo: http://tech.groups.yahoo.com/group/cyclesi/ with a subject beginning with “CATS: “.
The software is downloaded as a single zip file: http://www.cyclesresearchinstitute.org/cats-software/cats-v1.0.zip . (If the file does not download, right click and ‘Save link as’ to download). This should be downloaded and unzipped into “C:\Program Files\cats” directory (unless you are using Windows Vista or Windows 7, when you should put them somewhere else such as the desktop, as security issues prevent cats running from Program Files) and the readme.txt file should be read and its instructions followed before using the software.
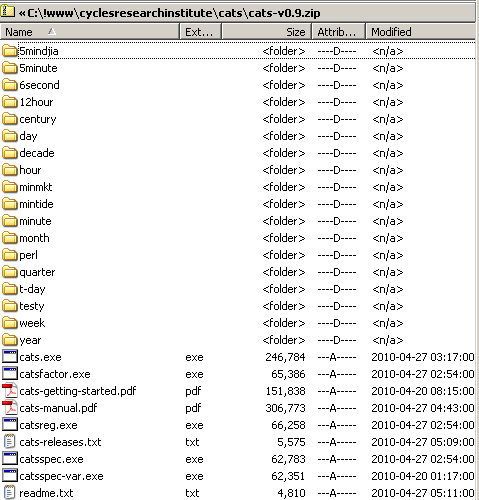
The software includes a number of .exe files, a manual in pdf format and a number of directories containing time series as cats format files.
Care has been taken in gathering the data and writing the programs, but no guarantee can be given that the data is all correct or that the software is free of bugs. The users take it all as it comes and hopefully find it useful in their research programs.
This project has been supported by Radiance Trust through giving a scholarship to William Zhou of Auckland University and paying an IT professional, Alexander Taler of Auckland, to complete the software conversion and extension, both working under the guidance of Ray Tomes of Auckland. The executables are offered for free use to cycles researchers. The software was originally written for minicomputers by Ray Tomes in the late 1970s and was converted and updated for PCs starting in 2008 with considerable extension in the types of and amounts of data that it could handle. All rights in the package remain with the copyright holders. It should not be repackaged nor distributed by others, but you are welcome to refer other people to this page to obtain the software for free.
CATS is a system for storing many timeseries with different time bases including yearly, monthly, weekly, daily and many more. It comes with hundreds of collected time series from around the world, including both scientific and market data such as climate, astronomical, geophysical, economic, commodities, prices, and much more.
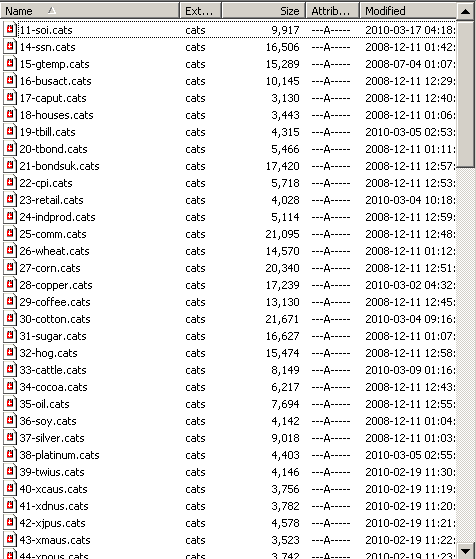
For each different period of measurement the files are stored in a separate folder (directory) so that there are at present 109 files with a base of measurements of month. Shown here is a part of the directory of “month” files. Each file has a number and a short name, with a long name inside the file. Within CATS files can be addressed be either the short name or the number. This allows repeated looping when many files are to have the same processing done on them, a powerful feature of CATS.
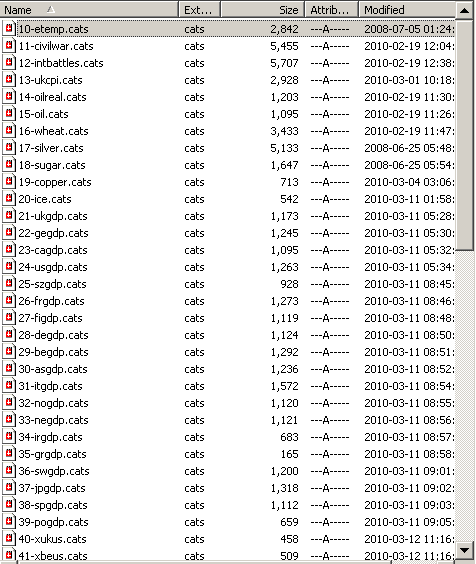
This is part of the list of files with base “year”. It includes files going back many centuries, including commodity prices, wars index and climatic variables and more.
CATS can analyse series and determine cycles periods and phases precisely, and has many functions for manipulating data such as arithmetic, logs and transformations. It also inlcudes mutivariate techniques like correlation, regression, factor analysis and other tools that are useful for model building for economics, climate and in general studying the causal pathways by which cycles are transmitted.
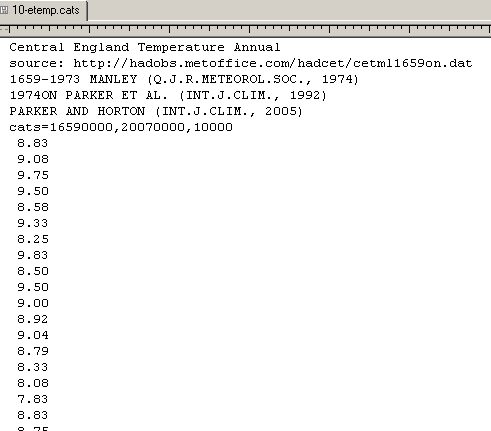
An example of the contents of a cats file is Central England Temperatures. It is an annual series running from 1659 to 1973. Within each cats file are recorded the long name, any applicable units of measurements and details of source of the data and notes. Then follows the “cats=” line giving the range of dates for which data is recorded. the data itself is recorded one value per line.
CATS can cope with missing data by the user simply leaving empty lines. This might be when there is a holiday for market data, or when no economic data was gathered due to war, or when some instrument on a space weather craft had a hiccup. CATS can treat missing data in several different ways including repeating the previous value or interpolating between known data points.
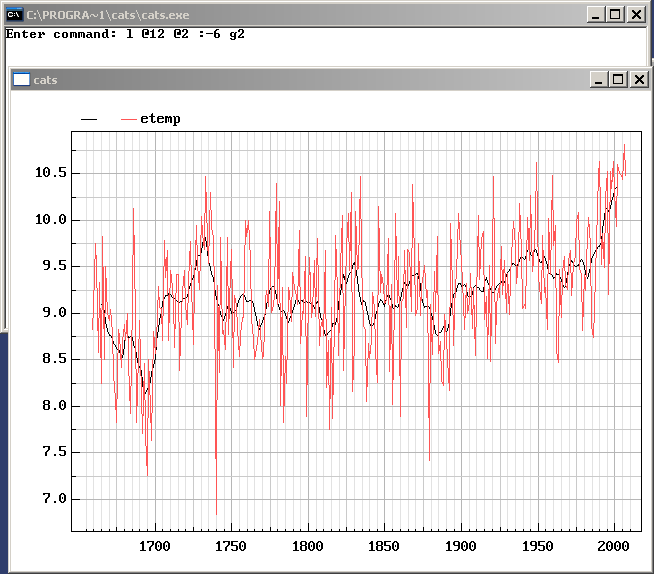
CATS uses a command language to gdo things. Files are accessed with the F command followed by the file number of name. Arithmetic is done by +, -, * and / commands. Graphs are drawn by the G command. And so on for the 40 or so commands.Here can be seen a file accessed and a graph drawn. CATS automatically determines the scale of graphs to nearly fill the space available and handles time soans ranging from hundreds of thousands of years down hours minutes and seconds.

Moving averages and other derived data are available as functions in cats language. Here a moving average is determined and graphed along with the original data.
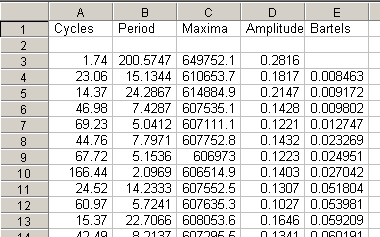
The spectrum command does an analysis of a single series and examines it for every possible cycle period (or just over a range if requested to do that). The result is a spectrum that can be graphed. This shows peaks wherever the series has stronger cyclicity. CATS spectral method is superior to methods like Fourier analysis (or FFT) because it determines cycles periods other than integral fractions of the whole data span. Once it has found cycles peaks it searches at very fine spacings to find the maximum amplitude cycle and stores these results in a table in CSV format. CATS does this type of thing for a number of complex functions meaning that all of that data can be saved for future reference if desired.

Shown is a list of cycles found by CATS in the English temperature data after loading to a spreadsheet and sorting with the strongest cycles first as measured by teh Bartels test. This test tells how likely such a cycle is to be the result of chance. Generally a Bartels test with p<0.05 would be considered significant, while p<0.001 would be considered a very reliable cycle.
Although a 200 year cycle is found, it cannot be significant with only 1.74 cycles present in the data. However the de Vries climate cycle is about this period so it is a real cycle.
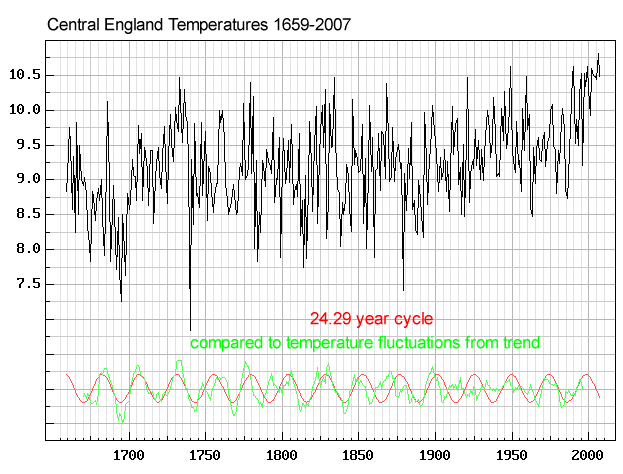
Multiple graphs can be displayed simultaneously and cats uses a different colour for each.
Here the fluctuations of the temperature from the trend are compared to a regular 24.29 year cycle, one that was found to be very significant when a spectrum was done.
(Note that a 24.29 year period is a frequency of about 0.04117 cycles / year and a large eak can be seen in the above spectrum at that frequency).
Download CATS Version 1.0 released 2-July-2010
Conditions of Use
Please read the readme.txt instructions contained in the zip file before proceeding.
This is free software but is not open source or freely distributable. Please do not supply any of these files to other people directly, but rather, please do supply a link to this page (https://cyclesresearchinstitute.org/cats/) so that they may receive the most recent version.