Cycles Analysis Software
Spectre Demo
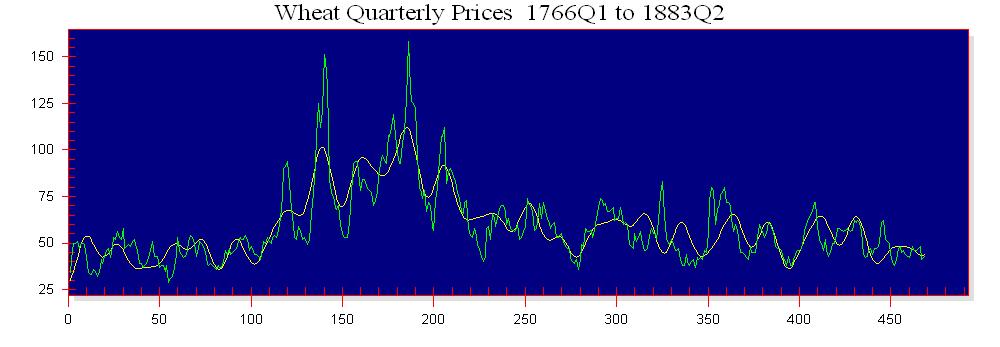
The developer of Spectre, Eugene Zawadzki, kindly offered to demonstrate his software with some example data. I (Ray Tomes) accepted this offer and provided him with some old wheat price data that I had previously analysed and presented under the topic Cycles Analysis Methods. This data is shown in graphic form below but was supplied in
text form.
Spectre Demo Output
 Spectre searched data file: Wheat Quarterly Prices  Wheat
      Using period table: C:\sp\Release\AUTOGEN.TBL
 Total MSE: 4.066e+002	  MSE explained: 2.854e+002 or 70.19%

  Feature    Period      Amplitude    Phase (deg)     MSE         %TMSE
  ------------------------------------------------------------------------
    1    3.91667e+002  1.231e+003      240.7    1.434e+002      35.26
    2    2.35000e+002  2.573e+002      102.8    5.520e+001      13.57
    3    1.56667e+002  2.365e+001      092.9    1.877e+001       4.62
    4    5.87500e+001  6.236e+000      009.5    1.875e+001       4.61
    5    2.23810e+001  5.927e+000      012.2    1.698e+001       4.18
    6    2.47368e+001  4.732e+000      261.3    1.113e+001       2.74
    7    2.93750e+002  8.195e+002      350.5    8.144e+000       2.00
    8    1.62069e+001  3.037e+000      231.2    4.693e+000       1.15
    9    3.91667e+001  2.936e+000      265.0    3.436e+000       0.84
   10    5.87500e+002  8.805e+002      130.3    2.912e+000       0.72
   11    2.13636e+001  2.012e+000      242.0    2.007e+000       0.49
  --------------------------------------------------------------------------
 Candidate periods: 29	  Features identified: 11	  MSE cutoff: 0.50 %
 Data points: 470	      Series length: 469        Avg X interval: 1
 Data mean: 58.6426	  Data RMS: 20.1868	  Sample rate: 1
 Run ended Wed Apr 06, 2005 09:33:21    Elapsed time 1 seconds
Spectre Demo Price Fit
Spectre Demo Periodogram
 >
>
Spectre Demo Histogram
 >
>
Spectre Demo Discussion
The above table has been done with the crude quarterly data and therefore the periods are in quarters not years. Converting to years the strongest periods found are:
97.9, 58.75, 39.17, 14.69, 5.595 years
In my original analysis I had used the original data and also repeated with the logs of the prices and with the differences of the log prices (effectively percentage change). As a result my extracted periods were biased more towards shorter periods than what Spectre reported, but included 14.3 and 5.54 years. It would be interesting to examine the difference between the figures 14.69–14.3 and 5.595–5.54 years.
Spectre Demo Comments by Eugene Zawadzki
Load the data under the File menu, select Analyze/Frequency Search, choose Autogen when asked, and it goes. Most problems occur getting the data into the program, so Spectre can automatically load several type of data. I usually buil in support for new data if a client really needs it. That’s how we grew to support Clementine Lunar Probe, Greenland Ice Core, European Data Format, and some others.
There are many many things one CAN do to pre-treat the data (over a hundred options, like smoothing, detrending, etc.) but you don’t need to use these to get a pretty good estimate of what’s going on in the data. I programmed lots of visualization options as well, for interpretation. I’m now finishing off 3-D waterfalls & contour plots to visualize the “evolution” (ALL data is nonstationary, really) of long data sets: Amplitude (or MSER) versus Period verus Time. I can see human physiology data “breathe” with variation in heart rate, time of day (circadian & ultradian rhythms) etc. And the same is true for paper mill QA data, seasonal commodities, you name it. For your case, the 5.95 year period turns out to itself breathe over time. You can probably see this in your Quarterly Wheat Price data by running what I call “Partitions”, overlapping segements of the data.
The process is very automated. I’ll try it if you want, but we really want thousands of points, not just a couple hundred. When I used EEG data for a NIH grant, I would look at over a hundred million points (all night sleeping subject) and multiple channels (EEG/EKG/HR/BP/O2/CO2…) as well. For this multi-variate data, Spectre puts up a “montage” showing all channels moving in sync. Many disorders are thus revealed which an in-office exam could never see.
The program will sell for from $300 to well over $1000 depending on what the client wants. I will also support an analyze-only approsch, an on-line service. My broadband email is codebri@yahoo.com.